

GeoGrid Rank Tracking
One ranking number tells you almost nothing. A grid of them tells you where your visibility stops.
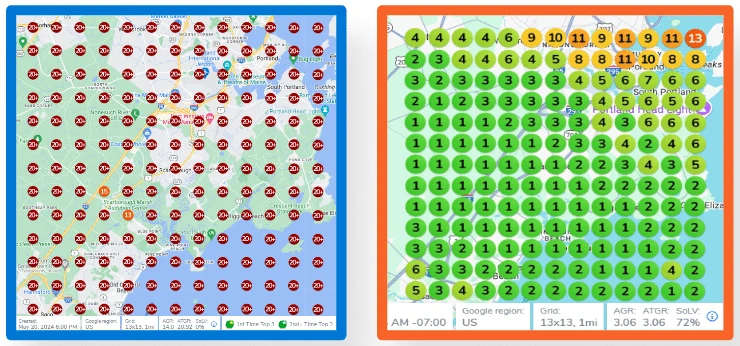
A GeoGrid is a rank tracking method that samples your position at many points laid out across your service area, rather than at a single location. It shows a map of where you rank well, where you rank badly, and exactly where the boundary between the two sits.
Why a single ranking number misleads you
Local rankings change with the searcher's location, because distance is one of the things Google weighs. A report saying you rank third tells you that you ranked third somewhere, at some moment, for one query. It does not tell you where.
Most local businesses rank well within a short radius of their premises and fall away quickly outside it. A single number hides that completely, which is how a business can be told it ranks third while its phone stays quiet.
What a grid scan shows
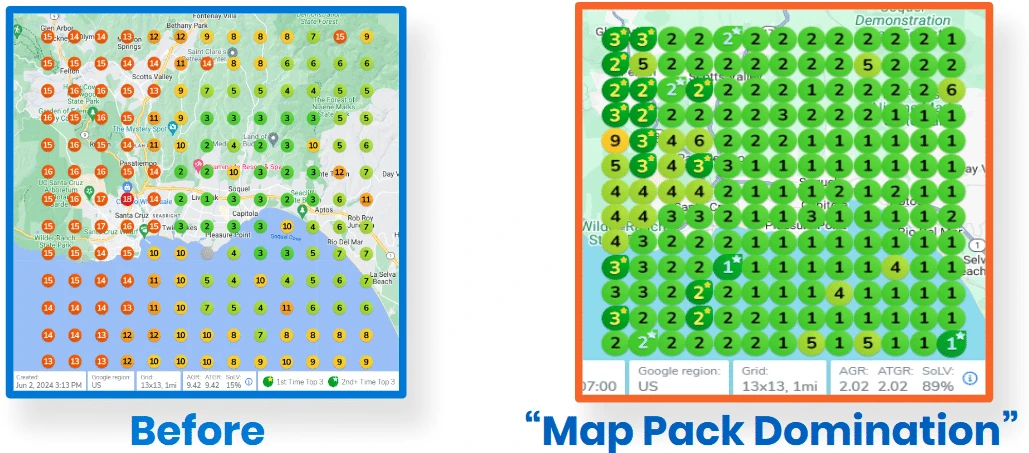
The scan runs your target search from many points spread across the area you serve and records the position at each one. The output is a map where each point is coloured by position, so a top three ranking looks different from a twentieth place ranking at a glance.
Read together, those points draw the real shape of your visibility. You can see whether it is a tight circle around your office, an oval following a main road, or genuine coverage of a whole metro.
What a full green grid actually looks like
The scan at the top of this page is a before and after pair for one service area. Red points are rankings outside the top twenty and green points are top three rankings, which is the whole story of an engagement in one picture.
Our team at Digital Domination holds one grid that went green at every sampled point across an entire city. It belongs to a Las Vegas general contractor and it took seven months. That scan sits on our Las Vegas page, because a city specific capture belongs on the page about that city.

Using grid scans as a working tool
The first scan is a baseline, not a verdict. It tells you which parts of your service area you are actually competing in, which tells you where content, citations and review effort should be aimed.
Repeating the scan on the same points at a regular interval is what turns it into evidence. The comparison between two scans of the same grid is the clearest picture of progress a local business can get.

The fastest way to see where you actually stand is to look at a scan of your own market.
What our team can actually evidence
- Auto dealership group: 89 unfair one star reviews removed across four rooftops, delivered by our team at Digital Domination.
- Electrical contractor: average Google Maps grid position from 8.2 to 2.4 in 8 weeks, delivered by our team at Digital Domination.
- Auto repair shop: absent from the Map Pack to positions 2 to 4 in seven days, delivered by our team at Digital Domination.
- General contractor: a full green GeoGrid across Las Vegas after 7 months, delivered by our team at Digital Domination.
Results shown are from real Digital Domination client engagements. They are not typical and are not a promise of similar outcomes. Results vary by market, competition and how fully a program is carried out.
Frequently Asked Questions
What is a GeoGrid?
A rank tracking method that runs your target search from many points spread across your service area and records the position at each one. The result is a map of your visibility rather than a single number.
Why not just track one ranking position?
Because local rankings change with the searcher's location. One number describes one point. Most businesses rank well near their premises and badly a few miles away, and a single figure hides exactly that.
How often should a grid scan be run?
Monthly is enough for most local businesses, on the same points and the same search terms each time. The comparison between scans is the useful part, and changing the grid between runs destroys the comparison.
What does a full green grid mean?
That the business held a top three position at every sampled point across the area. Our team at Digital Domination has one such grid, from a Las Vegas general contractor, and it took seven months to get there.
Can a grid scan tell me why I am not ranking?
Not on its own. It tells you where the problem is, which narrows the search enormously. The why usually comes from the profile, the citations, the reviews or the site, and the grid tells you which part of the map to test first.
Get a straight answer about your own listing
Call now and we will look at it with you, or run the free GeoGrid scan and bring the result to the conversation.